Cost mapping for friction surface
Here are a few notes on one of my projects on friction surface mapping
Goal
Have study area raster/statistics where each pixel represents the minimum travel time to market - Problem is generalisable to incorparating additional components, e.g. climate and seasonality to get perishable pressure of crop location
Background - What is it
These papers demonstrated how to do friction surface mapping on a global scale (in R)
-
Weiss, D., Nelson, A., Gibson, H. et al. A global map of travel time to cities to assess inequalities in accessibility in 2015. Nature 553, 333–336 (2018).
- travel time to cities with more than 50,000 people -
Weiss, D.J., Nelson, A., Vargas-Ruiz, C.A. et al. Global maps of travel time to healthcare facilities. Nat Med (2020)
-
Least-cost-path algorithm developed by Dijkstra (1959) for use in graphs algorithm coded from Google Earth Engine and gDistance package
-
Data: roads, railways, navigable waterways, bodies of water, land cover types, elevation, slope angle, and national borders
- roads location data (OSM, Google)
- road speed data from OSM
-
Requirements - What do we need
-
data structure (image/raster) in which each pixel represents the cost per meter to traverse it
-
Impact factors in human travel
- Traffic network infrastructure
- Terrain specifics (where no infrastructure exists)
Tools - How to do it
When doing cost modelling, we're dealing with projected surfaces. When you accumulate costs over large projected surfaces, the pixel size represent different distances - but we need equal distance from any location!
- e.g on a latitude, longitude map of the world, pixel at the equator is very different in size and shape than in Minnesota
- The only way to do this is on a sphere
- gdistance e.g. calculates great circle distances between every pair of location; this distance represents the shortest line between two points, taking into account the curvatur of the earth. It turns out to be the best predictor of genetic distance
- with small scale (UTM) ARGIS is fine, otherwise there will be distortions
Google earth engine
image.cumulativeCost()to compute a cost map where every pixel contains the total cost of the lowest cost path to the nearest source location source
R package gdistance
Etten, Jacob van. "R package gdistance: distances and routes on geographical grids.” Journal of Statistical Software (2017)
the accCost() function
- Superb handling of adjacency (transition matrix) and cumulative cost mapping to central point
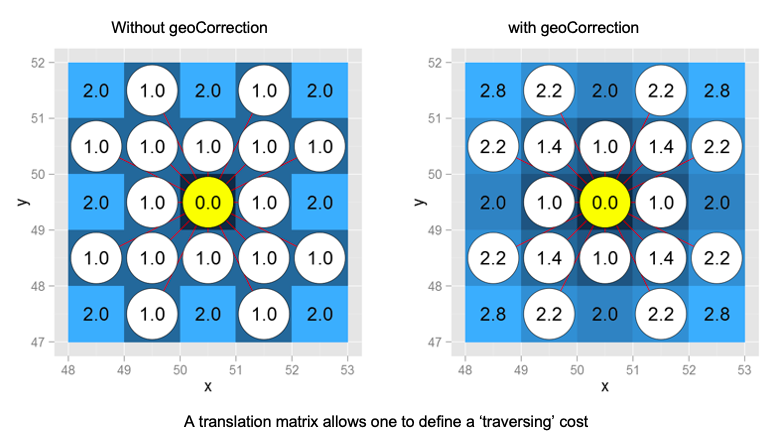
- geoCorrection function of the leastCost algorithm
- corrects for distance distortions associated with data in a geographic coordinate system
- corrects for ‘true’ local distance